Fruit of the algorithm: Generative fabric design

Fruit of the algorithm: Generative fabric design

This shirt was designed by code. More accurately, the fabric pattern was composed with the help of a generative design tool. It randomly selected and arranged images from the US Dept. of Agriculture's Pomological Watercolour collection to visualise hundreds (if not thousands and thousands) of different shirt designs. In my…

D3.js Pannable Chart Code Walkthrough

D3.js Pannable Chart Code Walkthrough

A code-walkthrough of one of Mike Bostock's d3.js examples, Pannable Chart. In this video, I look at a fairly simple area chart, with the added twist of a scroller to pan across the large area created by this visualisation. The walkthrough covers the CSS that provides this kind of…

Mapping the UK's oldest trademarks, part 2.

Mapping the UK's oldest trademarks, part 2.

The second of two parts, this video covers the front-end steps in creating a map of the UK's oldest trademarks. Here we visualise the trademarks data we gathered in part 1 using D3js by rendering a map of the UK with postal area boundaries, labelling and then filling with the…

Mapping the UK's oldest trademarks, part 1.

Mapping the UK's oldest trademarks, part 1.

The first of two parts, this video covers the data-gathering/prep side in creating this map of the UK's oldest trademarks.   How do you interrogate a 1M+ row CSV with (almost) all the trademarks filed for registration in the UK? In this video, we take a look at the data…

Dataviz: The UK's Oldest Trademarks

Dataviz: The UK's Oldest Trademarks

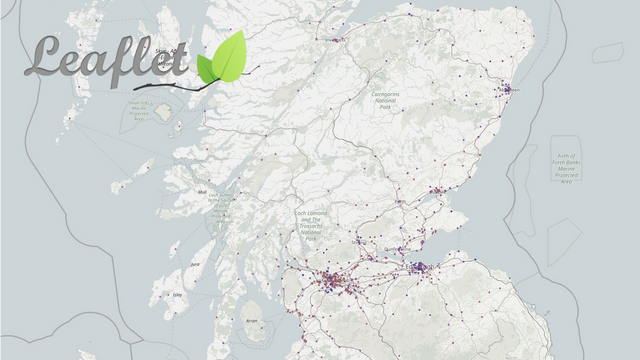
A map showing the oldest trademark for each postcode area in the UK . This data comes from the IPO which maintains a register of all the trademarks since the system started back in 1876. I'm currently in the process of recording two screen-casts on creating this data-viz. If you'd like…

Exploring data from Companies House

Exploring data from Companies House

This video is an introduction to getting data from Companies House. It shows the steps of how you can get company details using both the web interface and the API. In it, I discuss the limitations of the API, particularly when it comes to searching and retrieving non-standard details on…

Principles of D3.js, a talk at Edinburgh.js

Principles of D3.js, a talk at Edinburgh.js

A mostly introductory talk about D3.js at the Edinburgh.js monthly meetup. Contents: * Is D3 a charting library? What is it good for? * A taste of capabilities- what can the library do? * Core concepts (selections & data bindings) * Examples of d3.js in action * 'Tech Companies in Edinburgh' data visualisation…

Dataviz: Tech Companies in Edinburgh

Dataviz: Tech Companies in Edinburgh

A data visualisation exploring the growth of the tech industry from 1980 to 2022. Each dot on the graph represents a company incorporation in the city. This visualisation was created for my talk on Principles of D3.js at the Edinburgh.js Meetup (Summer 2022).…

An introduction to Creating with Data

Over the past few years, I've particularly enjoyed teaching coding and tech skills. This has been the case whether I've been teaching established developers a new framework, or helping newbies log that first 'hello world'. Regardless of how I spend most of my working days, I know I'll continue to…