
A map showing the oldest trademark for each postcode area in the UK . This data comes from the IPO which maintains a register of all the trademarks since the system started back in 1876.
I'm currently in the process of recording two screen-casts on creating this data-viz. If you'd like to follow along and see how to re-create this (or a similar) map thne check back for links which I'll post here. In the meantime, here's a little overview of the steps I took in creating the map.
Data gathering
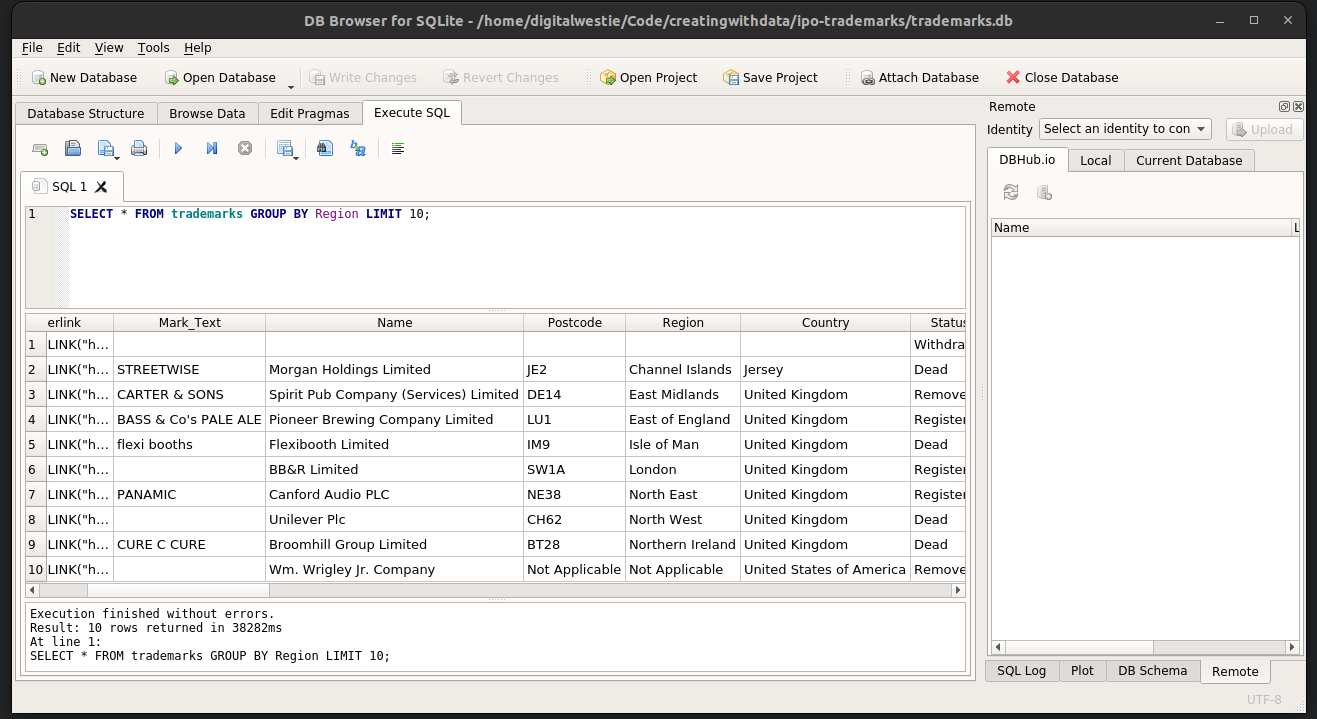
The trademark data comes in the form of 1m+ row csv file. Exploring it in a spreadsheet program like Excel was a bit impractical so I decided to import it into an SQLite database. Once the Python import script was figured out, SQLiteBrowser made it easy to navigate and run SQL queries to extract what I was after.
Painting and labelling boundaries with <pattern>
After reducing to the 120 or so trademarks for each postal code area, I downloaded the accompanying trademark images from the IPO site. The map is in the SVG format, with each boundary a path element. Path elements don't use the CSS 'background-image' property, you have to define a <pattern> element and reference it in the path's fill attribute. This is why the trademark imagery appears repated rather than a single image. In the code, I've tweaked the properties of these patterns so that they scale to the size of the area more or less. To make it look a lot nicer you'd need to do this by hand, but it took me long enough to figure out the right scaling formula.
Some trademarks are just text, so likewise text elements were scaled and centred over their boundaries. It took much tweaking and the help of a little rotation to avoid labels spilling across other boundaries whilst remaining readable. For some boundaries, (e.g. the London areas), no amount of tweaking was really going to help. They are just too small in relation to the rest of the map. I could've added a cutaway map in a box, but opted to work on a zoom function.
Zoom and scrolling behaviour
When I opened the map on my mobile, it looked worse than expected. Not just the scale but it was off centre too. I needed to re-formulate the projection to adjust for the size and aspect ratio of the device. To make matters worse, the zoom function was making it difficult to interact with.
For quite a while I tried to make it work for both platforms until I discovered that the mobile browser's standard zoom functionality works completely fine on its own. The end result was to disable the zoom behaviour for mobile if they were already zoomed in.
The key to this was in the VisualViewport API. Crucially, the scale property which can tell you whether the user has used a pinch interaction to zoom in. If you use a standard mouse scroll or CTRL+ to zoom in, visualViewport.scale will still equal 1 whereas it will increase for a pinch.