D3.js Spinning Globe Code Walkthrough
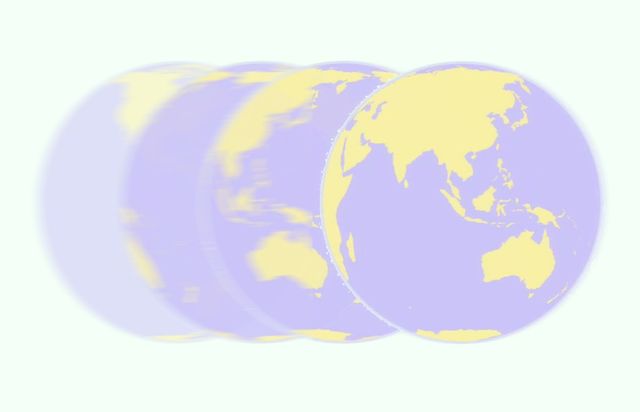
In this walkthrough, we look at the code behind this spinning globe graphic rendered to web canvas using D3.js. Links: * Spinning globe graphic * Code on Glitch * d3-geo documentation…
In this walkthrough, we look at the code behind this spinning globe graphic rendered to web canvas using D3.js. Links: * Spinning globe graphic * Code on Glitch * d3-geo documentation…
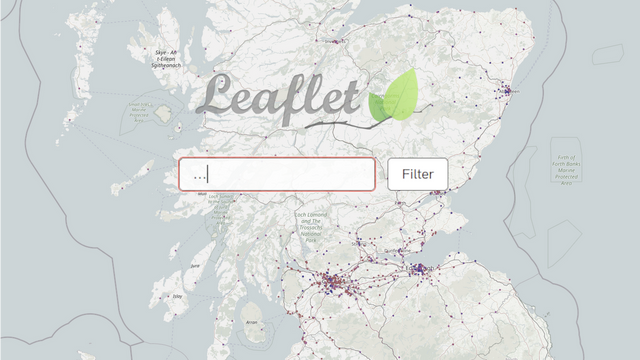
In this follow-up video, we add another method of filtering data on our doctors' practices map visualisation. If you're not too familiar with Leaflet or JavaScript in general, I recommend watching the first Leaflet.js video where we create our visualisation from scratch. You can find the complete map visualisation…
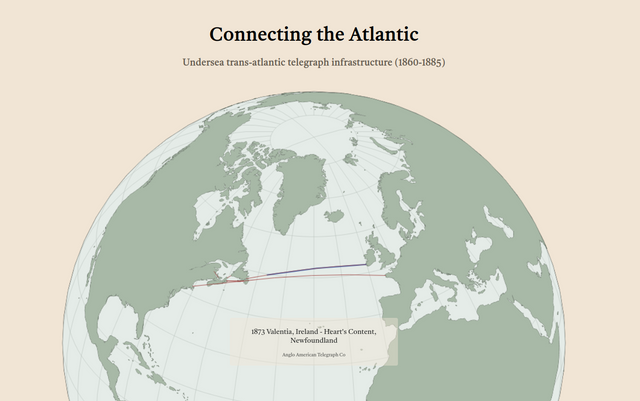
“A treaty of peace has been signed between Austria and Prussia” – the first message that was transmitted across the Atlantic via telegraph. That's the first connection that appears in this animated globe visualisation. It shows a timeline of various trans-Atlantic subsea telegraph connections starting with the first successfully laid cable…

Maps are some of the most shared and sought after forms of visualisation. In this video, I walk through an example that visualises unemployment data at the US county level. The code was updated from this bl.ocks.org v4 example to use d3.js version 7. The walkthrough touches…

The second of two parts, this video covers the front-end steps in creating a map of the UK's oldest trademarks. Here we visualise the trademarks data we gathered in part 1 using D3js by rendering a map of the UK with postal area boundaries, labelling and then filling with the…