
“A treaty of peace has been signed between Austria and Prussia” – the first message that was transmitted across the Atlantic via telegraph. That's the first connection that appears in this animated globe visualisation. It shows a timeline of various trans-Atlantic subsea telegraph connections starting with the first successfully laid cable in 1866.
Background
I've been looking out for something to combine globes / geospatial data and animation with d3 for a tutorial video. Listening to the audio book of Andrew Carnegie's autobiography, he describes one of his first job as a messenger boy for a telegraph firm, along with interesting anecdotes about the infrastructure of the time (mid-19th Century). This gave me the idea to look into the history a little more and I discovered some excellent resources. The highlight was this site jam-packed with timelines and history on undersea communication infrastructure. You have to love the classic table element web-design.
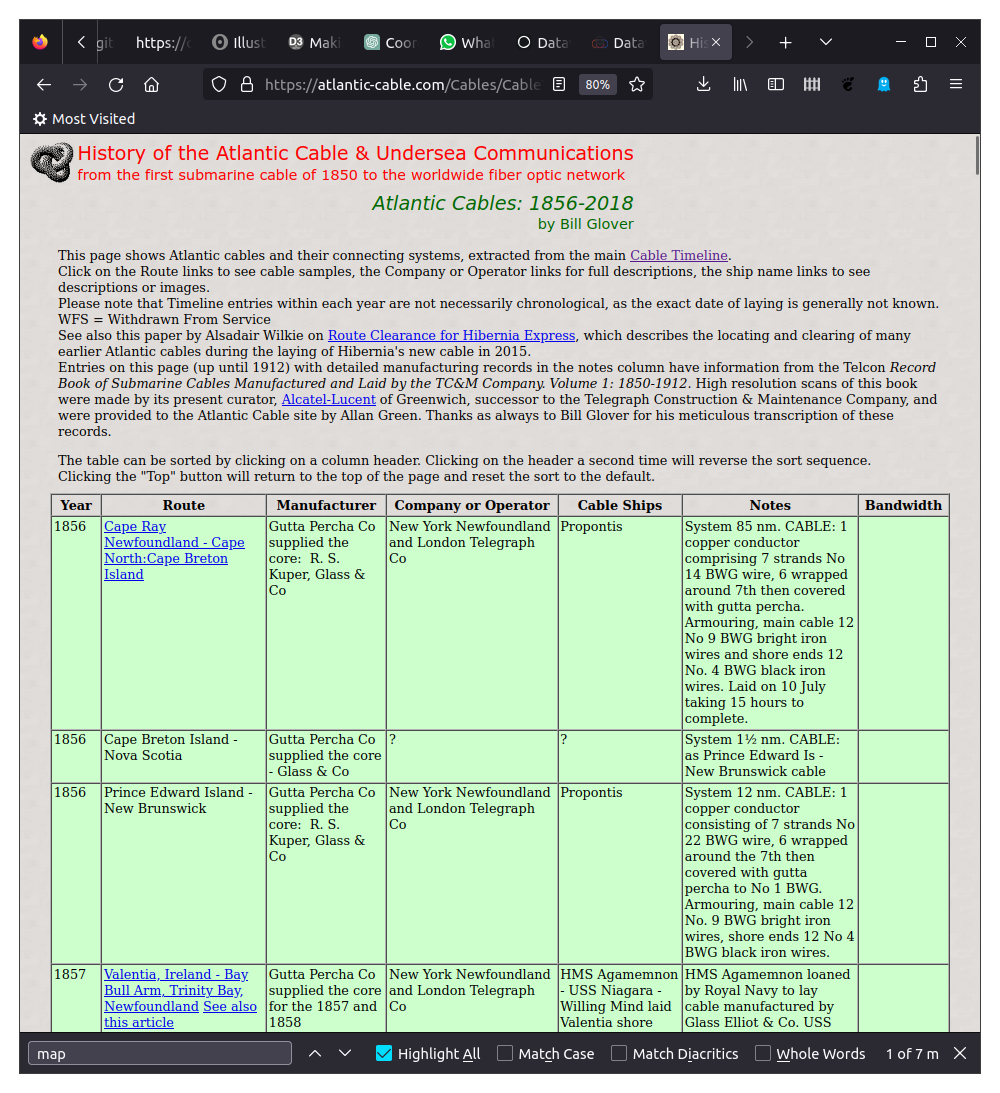
They host some lovely maps too!
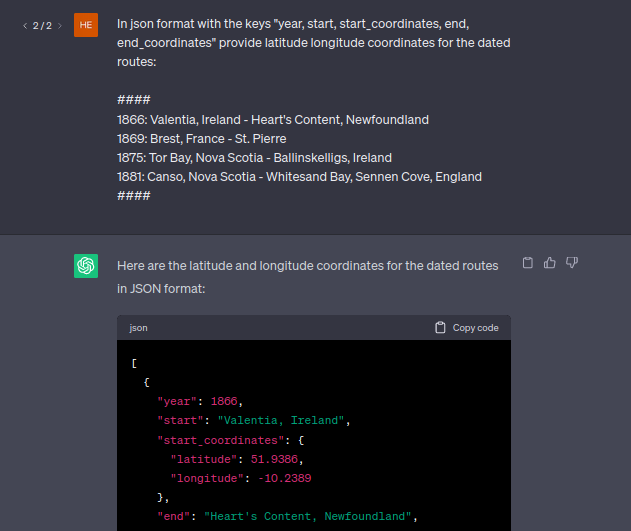
Geocoding and converting to JSON with ChatGPT
Helpfully the timeline information was already in a table which I saved to CSV format. It didn't have coordinate data for the routes and I knew I'd rather work in JSON. I thought I'd take a shot at re-structuring the table into JSON and asking for coordinates for the start and end points of the routes. To make things simpler I split up certain routes so they had a single start and end point. I haven't double checked every coordinate provided by ChatGPT but they've been accurate enough for the purposes so far!