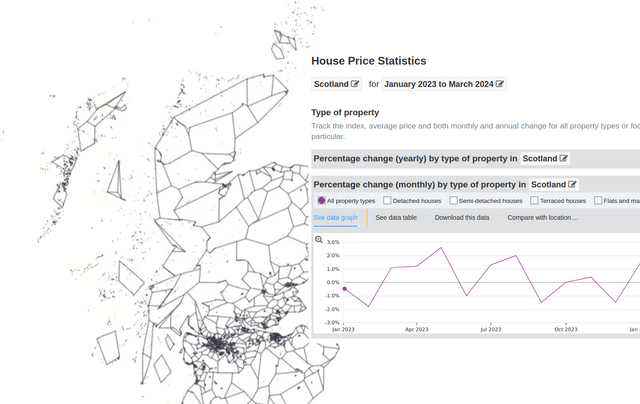
Choropleth mapping house sale prices - Part 1. Data Prep
Part 1 of 2 posts on making a choropleth map of house sale data using d3.js and mapshaper.…
Part 1 of 2 posts on making a choropleth map of house sale data using d3.js and mapshaper.…
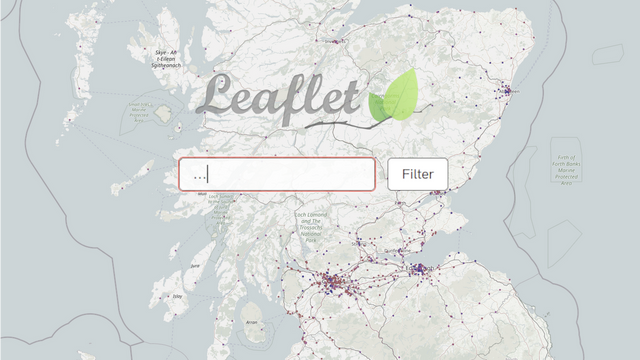
In this follow-up video, we add another method of filtering data on our doctors' practices map visualisation. If you're not too familiar with Leaflet or JavaScript in general, I recommend watching the first Leaflet.js video where we create our visualisation from scratch. You can find the complete map visualisation…
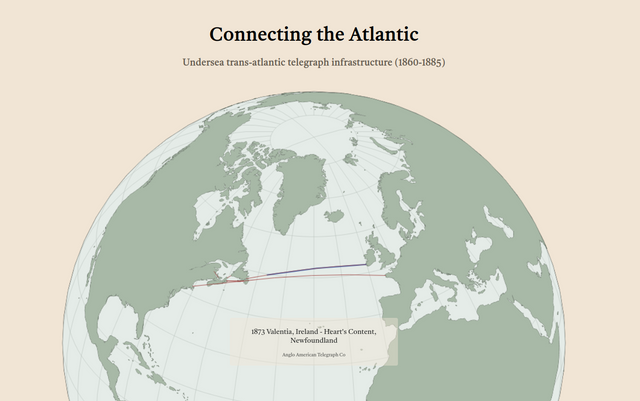
“A treaty of peace has been signed between Austria and Prussia” – the first message that was transmitted across the Atlantic via telegraph. That's the first connection that appears in this animated globe visualisation. It shows a timeline of various trans-Atlantic subsea telegraph connections starting with the first successfully laid cable…
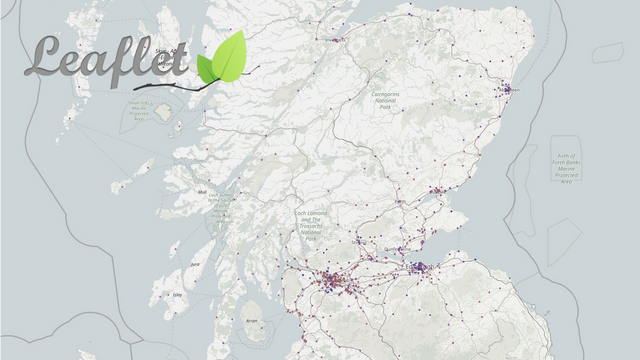
In this video, we visualise data from a spreadsheet of doctors' practices and prescriptions adding two methods for filtering. We deal with the issue of combining the two separate filters as one has a knock-on effect on the other. NB- the data is synthetic, it's just modelled on the real…