
Saving D3.js animations as video files with WebAssembly
Browsers are more powerful than ever! Now we can use FFmpeg + Resvg in the browser to save D3 animations as video files.…
Browsers are more powerful than ever! Now we can use FFmpeg + Resvg in the browser to save D3 animations as video files.…
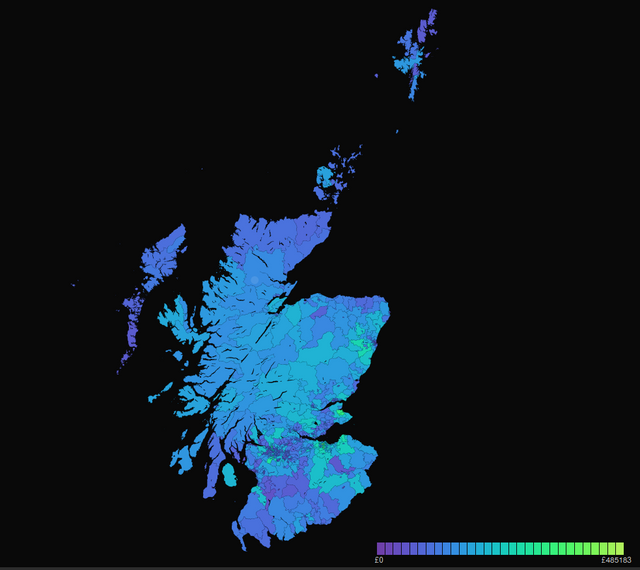
How to map house prices in an interactive choroplath visualisation using d3.…
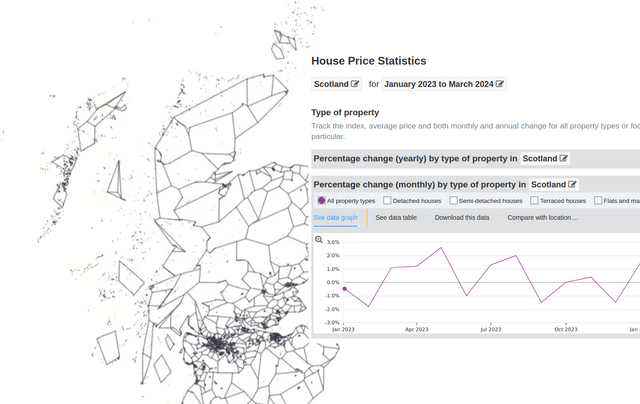
Part 1 of 2 posts on making a choropleth map of house sale data using d3.js and mapshaper.…
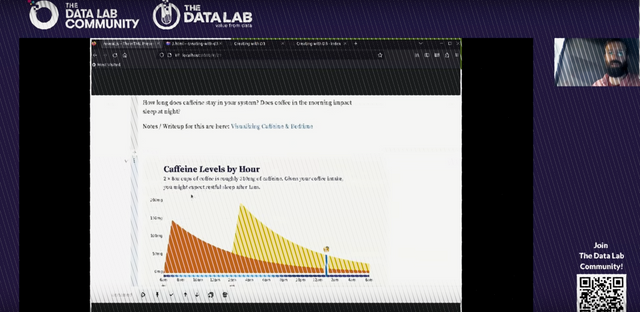
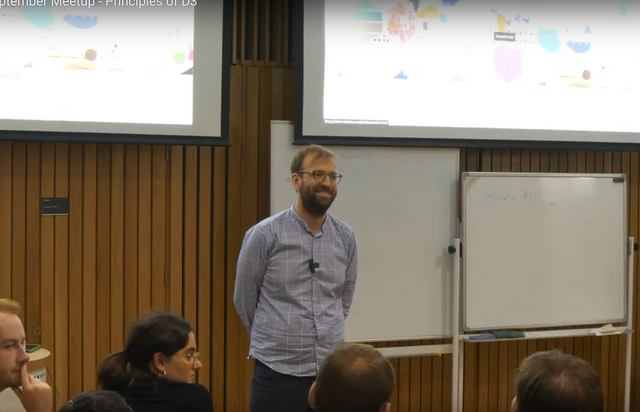
Last week I ran a webinar for The Data Lab Community. The aim of the webinar was to provide a hands-on introduction to D3, and cover: * What D3 is, and what it's not * Capabilities of the library * How to use 'data-bindings' to power your visualisations * How to manipulate SVG elements…
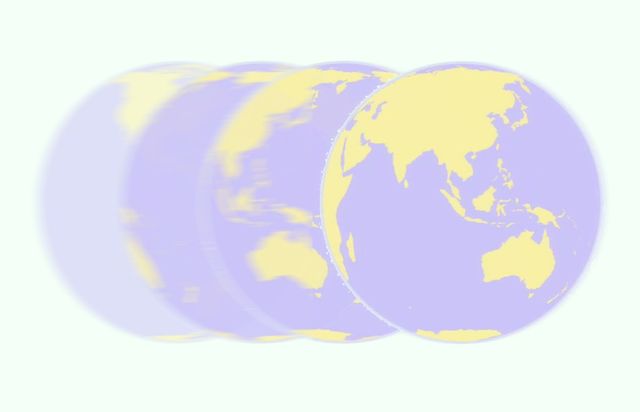
In this walkthrough, we look at the code behind this spinning globe graphic rendered to web canvas using D3.js. Links: * Spinning globe graphic * Code on Glitch * d3-geo documentation…
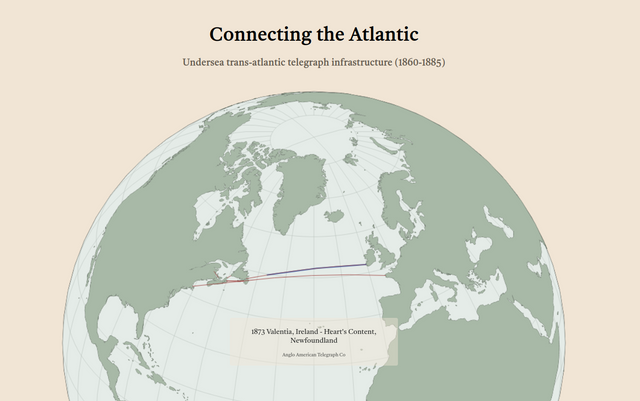
“A treaty of peace has been signed between Austria and Prussia” – the first message that was transmitted across the Atlantic via telegraph. That's the first connection that appears in this animated globe visualisation. It shows a timeline of various trans-Atlantic subsea telegraph connections starting with the first successfully laid cable…

Maps are some of the most shared and sought after forms of visualisation. In this video, I walk through an example that visualises unemployment data at the US county level. The code was updated from this bl.ocks.org v4 example to use d3.js version 7. The walkthrough touches…

This screencast shows how to code a generate fabric patterns and visualise them as shirts using SVG and D3js. The patterns are composed of images gathered from an archive of botanical watercolours held by the US Department of Agriculture. For some context about the project I've written a post about…
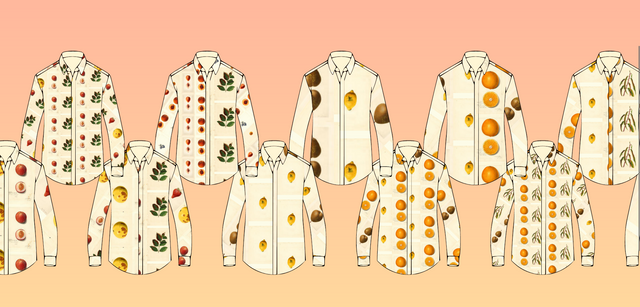
This shirt was designed by code. More accurately, the fabric pattern was composed with the help of a generative design tool. It randomly selected and arranged images from the US Dept. of Agriculture's Pomological Watercolour collection to visualise hundreds (if not thousands and thousands) of different shirt designs. In my…

A code-walkthrough of one of Mike Bostock's d3.js examples, Pannable Chart. In this video, I look at a fairly simple area chart, with the added twist of a scroller to pan across the large area created by this visualisation. The walkthrough covers the CSS that provides this kind of…

The second of two parts, this video covers the front-end steps in creating a map of the UK's oldest trademarks. Here we visualise the trademarks data we gathered in part 1 using D3js by rendering a map of the UK with postal area boundaries, labelling and then filling with the…
A mostly introductory talk about D3.js at the Edinburgh.js monthly meetup. Contents: * Is D3 a charting library? What is it good for? * A taste of capabilities- what can the library do? * Core concepts (selections & data bindings) * Examples of d3.js in action * 'Tech Companies in Edinburgh' data visualisation…