
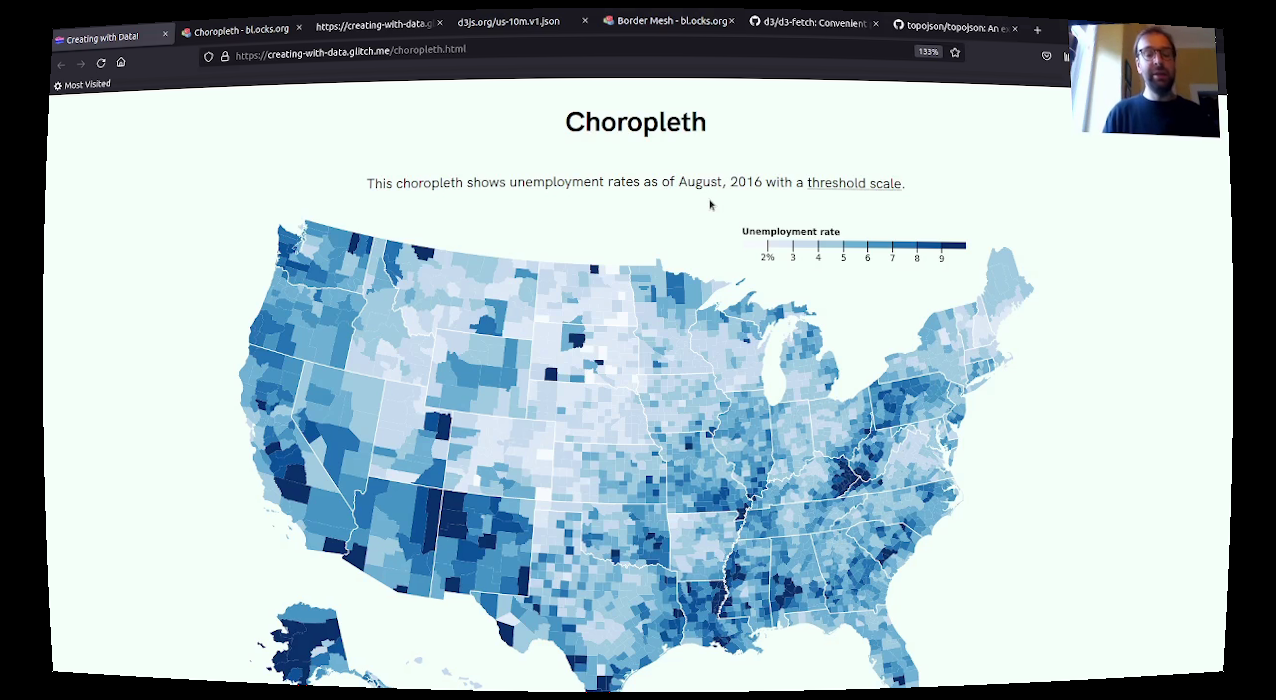
Maps are some of the most shared and sought after forms of visualisation. In this video, I walk through an example that visualises unemployment data at the US county level. The code was updated from this bl.ocks.org v4 example to use d3.js version 7. The walkthrough touches on using d3-fetch to retrieve data on the web, as well as some basics of rendering geographic data.
Notes:
- Choropleth map code on Glitch
- 'Map' object documentation on MDN
- Topojson repo on GitHub
- 'Introducing asynchronous JavaScript' article on MDN