Super Map World is a site that offers over 17,000 maps and map graphics. They're colourful. They're free! And best of all, they're customisable using a map edit feature.
It's one of the biggest side projects I've committed to. Over the course of the next few posts I'm going to write up my approach to, and experience of, building Super Map World (SMW).
I'll cover:
- The tech stack (Ruby on Rails, StimulusJS, D3js, Tailwind)
- Gathering geographic data for 200+ countries
- Deployment and configuring a CDN
- Challenges and how they were overcome (or worked-around)
- Lessons on launching SMW onto the web
- Developing an add-on for Adobe Express
Version 0
My favourite types of data-viz / creative tech projects for Creating with Data have involved generative design and maps. I began to wonder if there was some scope to combine these elements.
Taking a generative design approach is a great way to turn out effective and aesthetically pleasing graphics. Why not try it with maps?
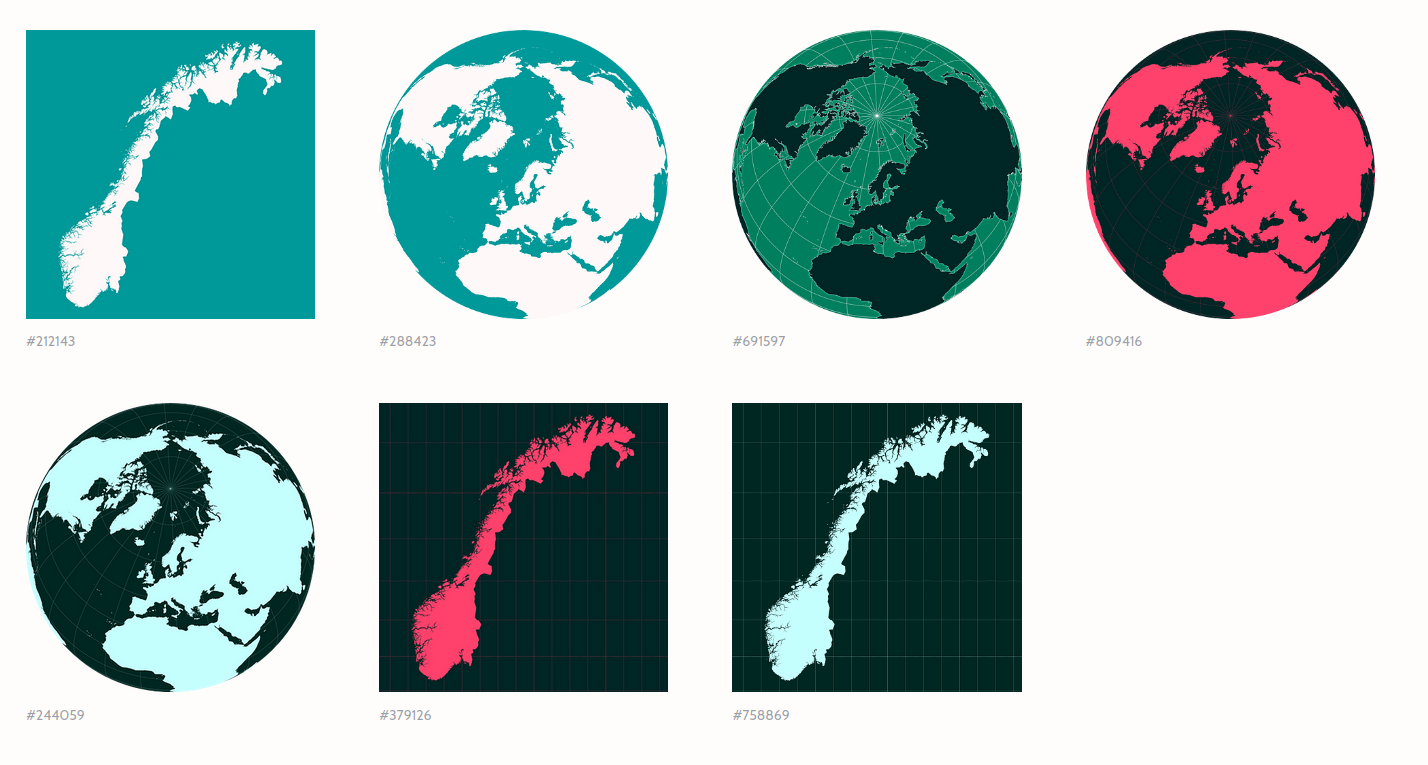
I began a playing around with d3.js, rendering world maps in different styles.
This version randomly selected colours for the land, water, and (optionally) graticule from a list of CSS named colours. Graticule, shadow, and stroke widths were randomly decided too.
This was the job of a generateStyle function, that output a mapStyle object containing the various visual properties to be applied at time of render. Here's a little snippet from the function:
{
  "land": {
    "hasShadow": false,
    "visible": true,
    "fillStyle": randomColours[0],
    "strokeVisible": (Math.random() >= 0.5),
    "strokeStyle": randomColours[1],
    "lineWidth": 2 * Math.random() + 0.05
  },
  "water": {
    "fillStyle": randomColours[2],
    "strokeStyle": randomColours[3],
    "strokeVisible": (Math.random() >= 0.5),
    "lineWidth": 2 * Math.random() + 0.95
  },
  "graticule": {
    "visible": hasGraticule,
    "strokeStyle": randomColours[4],
    "lineWidth": 2*Math.random() + 0.05
  }
 ...
Land, water, graticule, are all elements of any map you might generate. Later on, I added "borders" to the object to control the style of boundaries. Most of the keys here correspond more or less to the names of the functions call when drawing with the Web Canvas API.
Contrast correction
At first, random selection meant some colours were the same or too close. Landmasses and lines ended up barely visible in the odd rendering. The theme generator needed to correct for contrast so I ended up with a function that reselected until contrast was high enough.
// Function to randomly select pairs of colors until the contrast value is above min

function findColorsWithContrast(color1, requiredContrast) {
  if (requiredContrast === undefined) { requiredContrast = 1.22; }
  let color2, contrast;
  let i = 0;

  do {
    if (color1 === undefined) { color1 = getRandomColorName(); }
    color2 = getRandomColorName();
    contrast = calculateContrast(color1, color2);
    contrast = Math.round(contrast * 100) / 100;
    //console.debug(`%c■■■■ ${i} ${contrast} ${color1} ${color2}`, `color: ${color1}; background: ${color2}; font-size: 20px;`);
    i+=1;
  } while (contrast <= requiredContrast);

  return {
    color1: color1,
    color2: color2,
    contrast: contrast
  };
}
Since colours in CSS can be defined in a number of different ways (e.g. rgb, hsla, 'black', etc.) d3's 'd3-color' module was dead handy. It helps you parse those different colour spaces and manipulate them. Digging into colour spaces was an eye opener.
Do you know your colours?
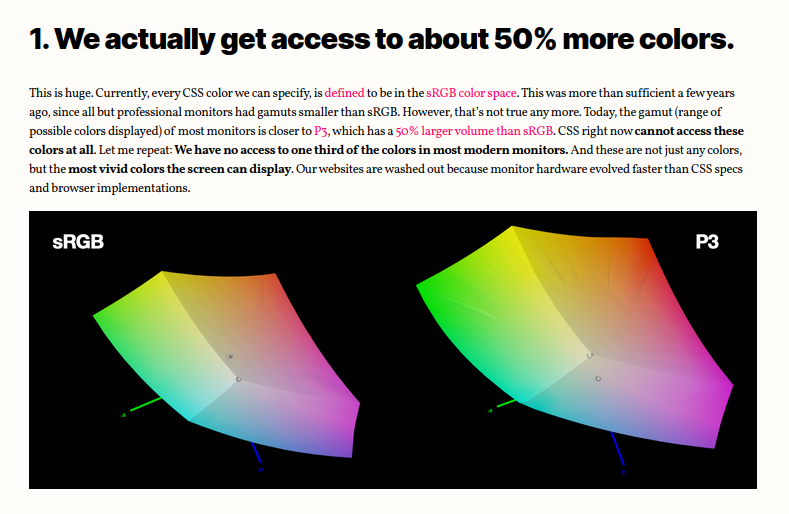
This is a bit of a tangent, but one worth mentioning. For most of my career I've defaulted to RGB and HEX but this experience helped me understand the benefits of using HSLA colour expressions. It also introduced me to the LCH colour space. Lea Verou's article on the topic is incredible -
"Today, the gamut (range of possible colors displayed) of most monitors is closer to P3, which has a 50% larger volume than sRGB. CSS right now cannot access these colors at all. Let me repeat: We have no access to one third of the colors in most modern monitors."
The vision appears
When I set out, the intention was to come up with an interesting example to post here on Creating with Data.
Rather, what happened was that I was seduced by all the possibilities and combinations that could be realised with the same approach - randomising all the different projections, styling boundaries, highlighting regions, using transparency, using geographic data from different sources, so many possibilities!
A thassalaphilia kicked in. I wanted to dive in deeper.
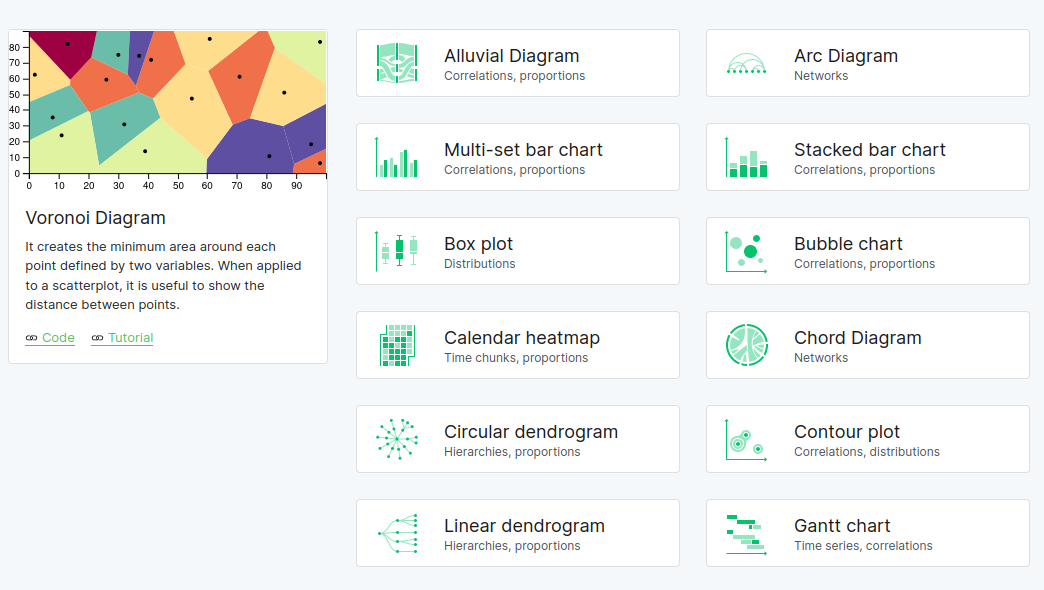
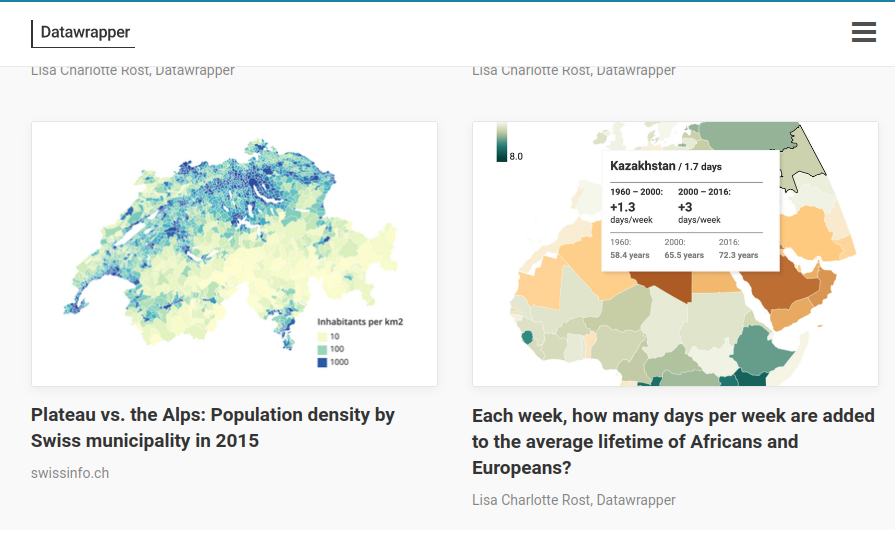
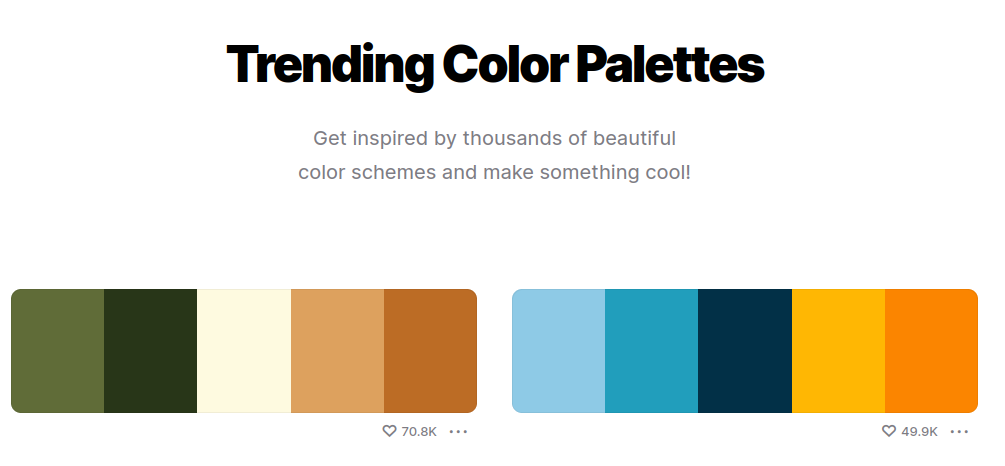
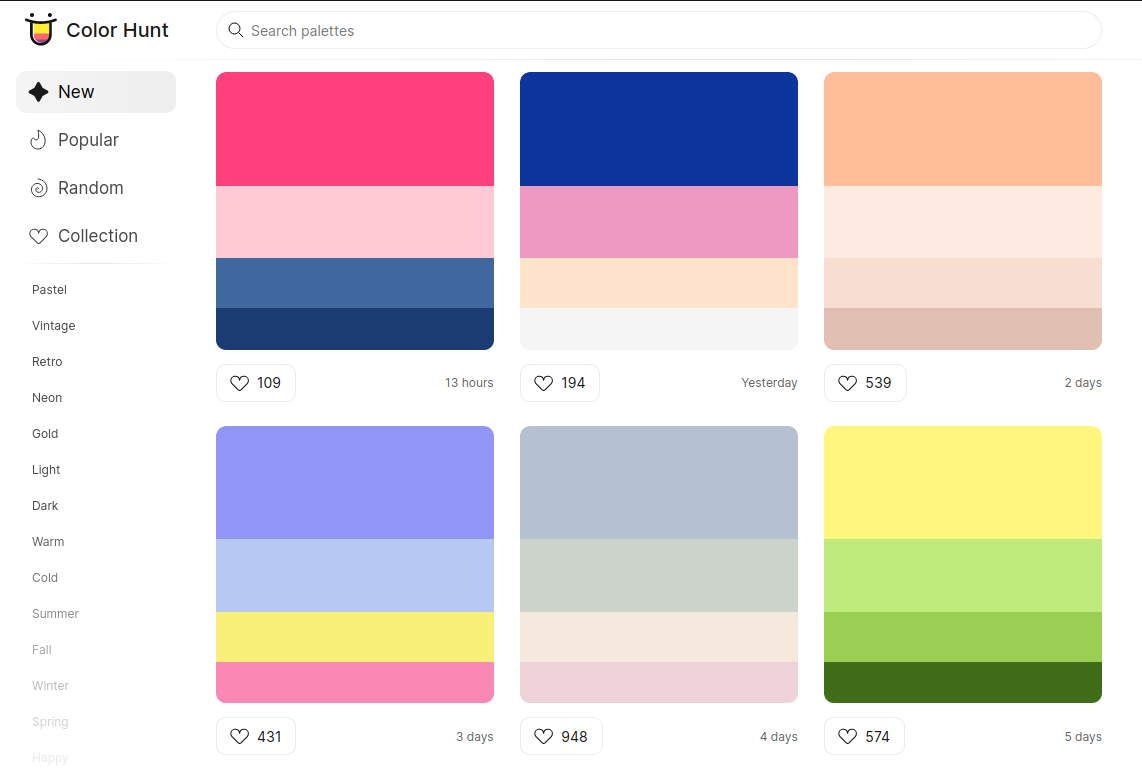
Extending the features of the single page experiment, I began to imagine a web-application that could be used to quickly create attractive maps and map graphics. Something in the spirit of colour palette inspiration tools such as Coolors or ColorHunt, but also with the utility of a easy infographic and dataviz tools such as Datawrapper or RAWGraphs.
The start point was a single html file plus a couple of JS files. The goal was an application that could support users and offer them value added premium features – all while supporting open access.
🎵 I hear that train a-comin'
As this was becoming a bit more ambitious. I decided to reach for the web-framework that I know and love best, Ruby on Rails. It's arguable a JS-based framework would have made more sense considering I was already knee deep in Javascript. That said, I know first hand that employing shiny new tools is a deadly distraction for any new project.
Getting this up quickly was also a priority. Learning a new framework was not on the critical path. And, as much as I get a rush typing `rails new`, I decided the smarter move was to start with an open source template app.
In the next post, I'll go through the first steps in setting up the Rails app that became Super Map World.
Btw, if you haven't already, do play around with SMW! Feedback is appreciated! You can also find SMW on Instagram.
I will be extra grateful if you could share with your carto, map, or graphic-design inclined friends. This can contribute to the post on SEO / marketing (even though I don't have much to teach in that regard).