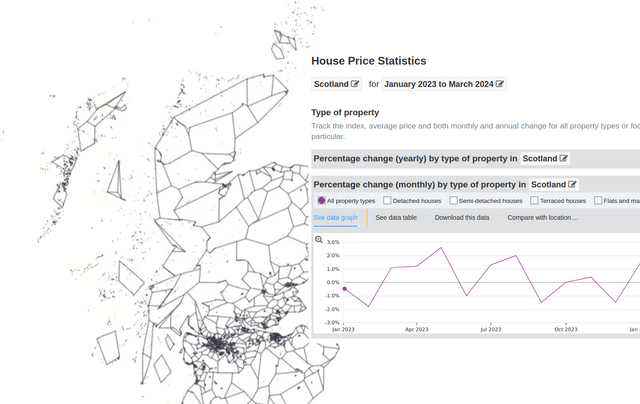
Choropleth mapping house sale prices - Part 1. Data Prep
Part 1 of 2 posts on making a choropleth map of house sale data using d3.js and mapshaper.…

Part 1 of 2 posts on making a choropleth map of house sale data using d3.js and mapshaper.…

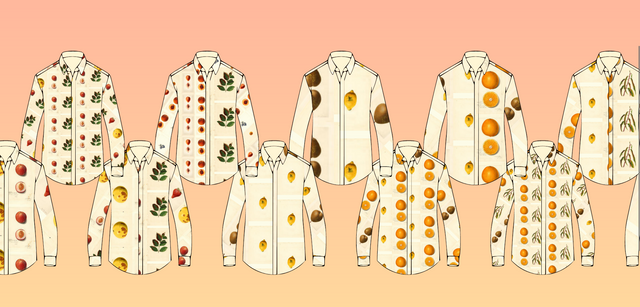
This screencast shows how to code a generate fabric patterns and visualise them as shirts using SVG and D3js. The patterns are composed of images gathered from an archive of botanical watercolours held by the US Department of Agriculture. For some context about the project I've written a post about…

This shirt was designed by code. More accurately, the fabric pattern was composed with the help of a generative design tool. It randomly selected and arranged images from the US Dept. of Agriculture's Pomological Watercolour collection to visualise hundreds (if not thousands and thousands) of different shirt designs. In my…

The second of two parts, this video covers the front-end steps in creating a map of the UK's oldest trademarks. Here we visualise the trademarks data we gathered in part 1 using D3js by rendering a map of the UK with postal area boundaries, labelling and then filling with the…