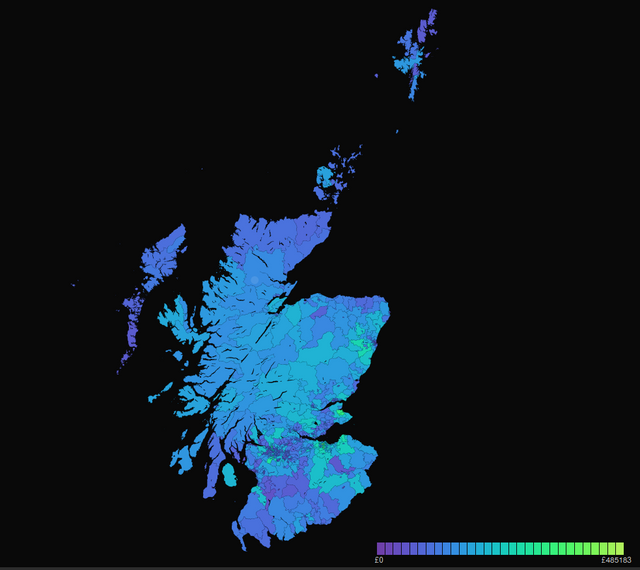
Choropleth mapping house sale prices - Part 2. Visualisation
How to map house prices in an interactive choroplath visualisation using d3.…

How to map house prices in an interactive choroplath visualisation using d3.…

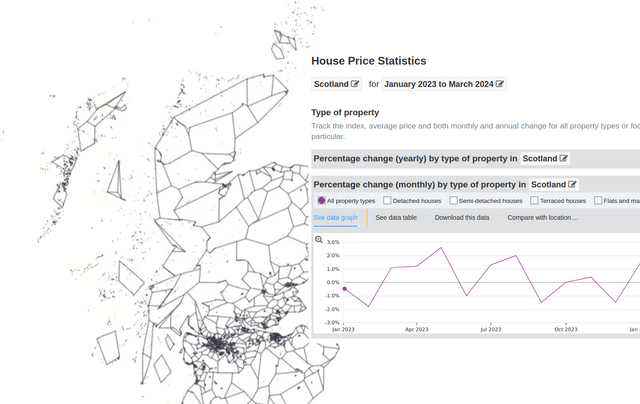
Part 1 of 2 posts on making a choropleth map of house sale data using d3.js and mapshaper.…

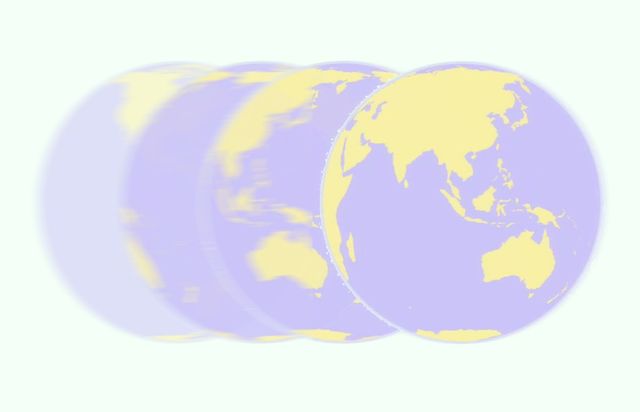
In this walkthrough, we look at the code behind this spinning globe graphic rendered to web canvas using D3.js. Links: * Spinning globe graphic * Code on Glitch * d3-geo documentation…

A code-walkthrough of one of Mike Bostock's d3.js examples, Pannable Chart. In this video, I look at a fairly simple area chart, with the added twist of a scroller to pan across the large area created by this visualisation. The walkthrough covers the CSS that provides this kind of…