Enhance your visualisation and creative technology skills with a 1-day immersive into D3.js.
What is it?
It's a course on D3.js (Data-Driven Documents), a JavaScript library for creating unique, interactive data visualisations for the web. It's used by organisations such as Netflix, Moody's, and the New York Times to gain insight and communicate stories with data.
D3 “slingshotted the field into growth, diversification and creativity that has been unprecedented” and “changed how millions of data visualiations are created across newsrooms, websites, and personal portfolios,” - Information is Beautiful
D3 goes beyond charts. It's one of the most expressive tools for creating graphics on the Web and combines well with frameworks such as React or Svelte.
What happens on the course?
We start with an introduction and review of the principles that underpin any and all D3 visualisations. We'll look at the documentation and resources that will set you up for tackling hands-on exercises.
The format of the day is designed to support participants of different levels working at their own pace. We'll end the day with some self-directed time giving you the chance to work on a project, dataset, or further pre-set exercises with instructor support.
Who is it for?
For practising or aspiring...
- Data scientists
- Front-end developers
- Data analysts
- Creative technologists
- Data journalists
- Information designers
...and/or anyone looking for a high precision instrument to master visual output on the web. D3.js is a library that offers a high-degree of customisation and flexibility.
You could be completely new to D3, or you may have already built a few visualisations and are ready to upskill further.
Wait, why is this not online?
Hands on assistance means we can tailor instruction and help accelerate learning in ways that aren't offered by video or remote courses. Places are capped to ensure you have some 1-to-1 time. In-person also means you can learn and benefit from your peers in attendance.
About the instructor
 "I'm Rory, a trainer and technology consultant with 11+ years experience working with start-ups, universities, non-profits, and public sector organisations.
As much as I enjoy experimenting with technology and making ideas come alive, I love to help others do the same.
You can find my tutorials and screencasts right here on creatingwithdata.com.
"
Are there any prerequisites?
You don't need any experience with D3.js. However, it's expected you're familiar with the basics of web-development with HTML, CSS, and JavaScript. If you're not sure, please get in touch!
What topics will be covered?
Among other things the following will be covered:
- Fetching and manipulating data
- Manipulating the DOM with data bindings
- Drawing SVG shapes
- Converting data to visual domain
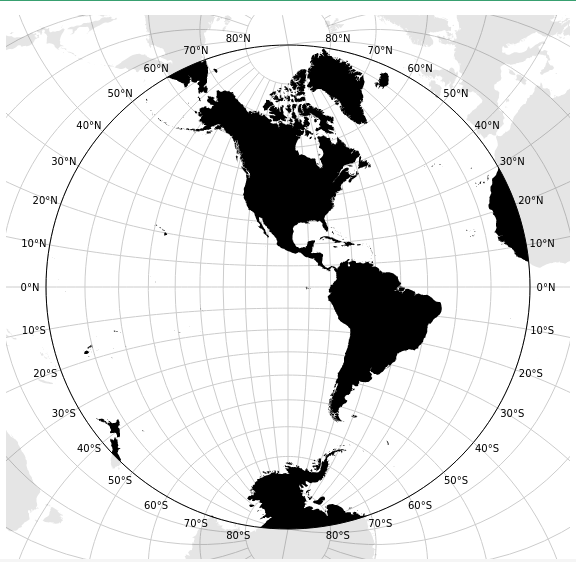
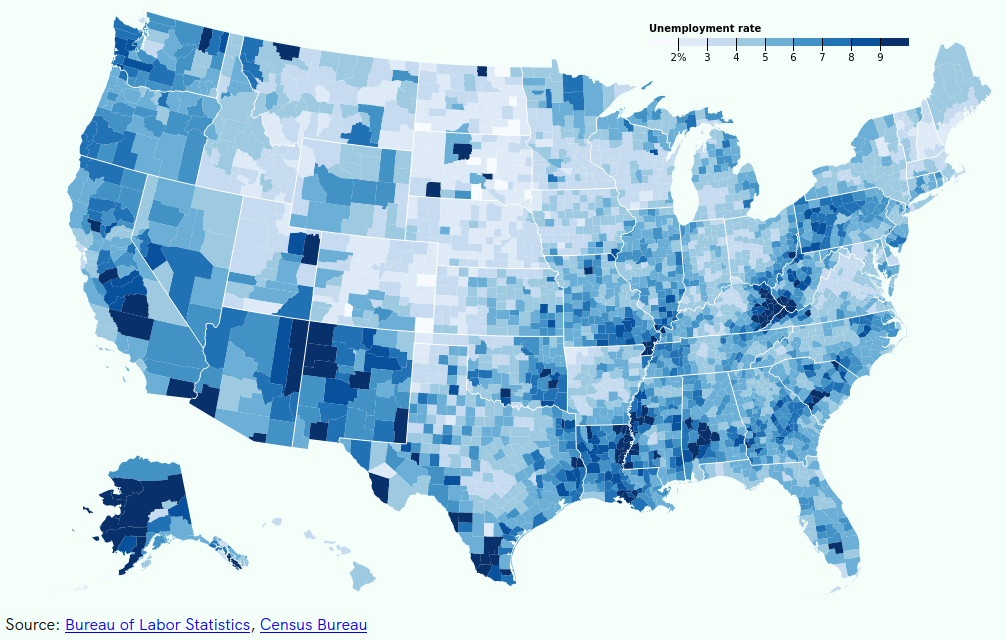
- Maps and specific visualisation e.g. networks
There's this one thing I'd like focus on, will we have time for that?
If there's anything you'd particularly like to focus on, please get in touch ahead of the course and we'll see if we can't incorporate it! The day will end with some self-led time so this is also an opportunity to investigate any specific areas of interest.
I'm new to D3, what can I build with it?
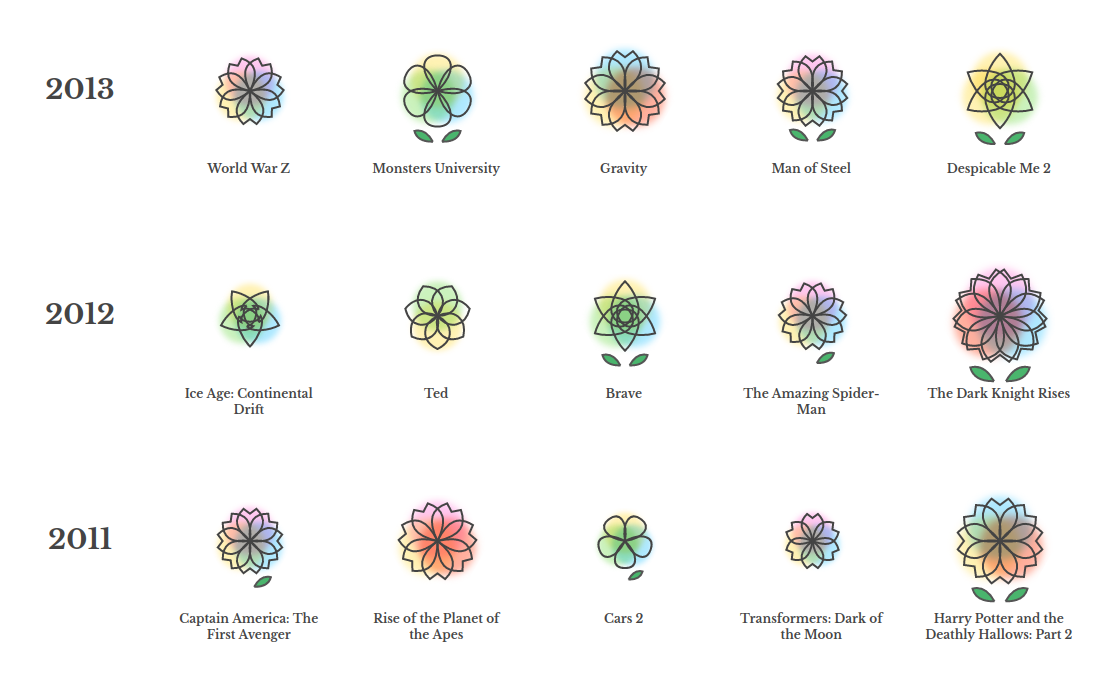
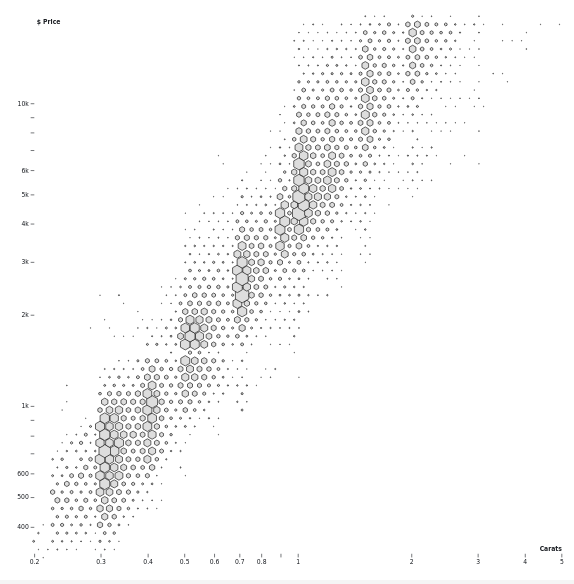
If you've not tried D3.js yet, it's lightweight, fully supports web standards, and works well with large datasets. D3.js isn't just about charts, you can build:
- Generative art
- Interactive visualisations
- Data dashboards
- Custom UI controls
- Visual stories
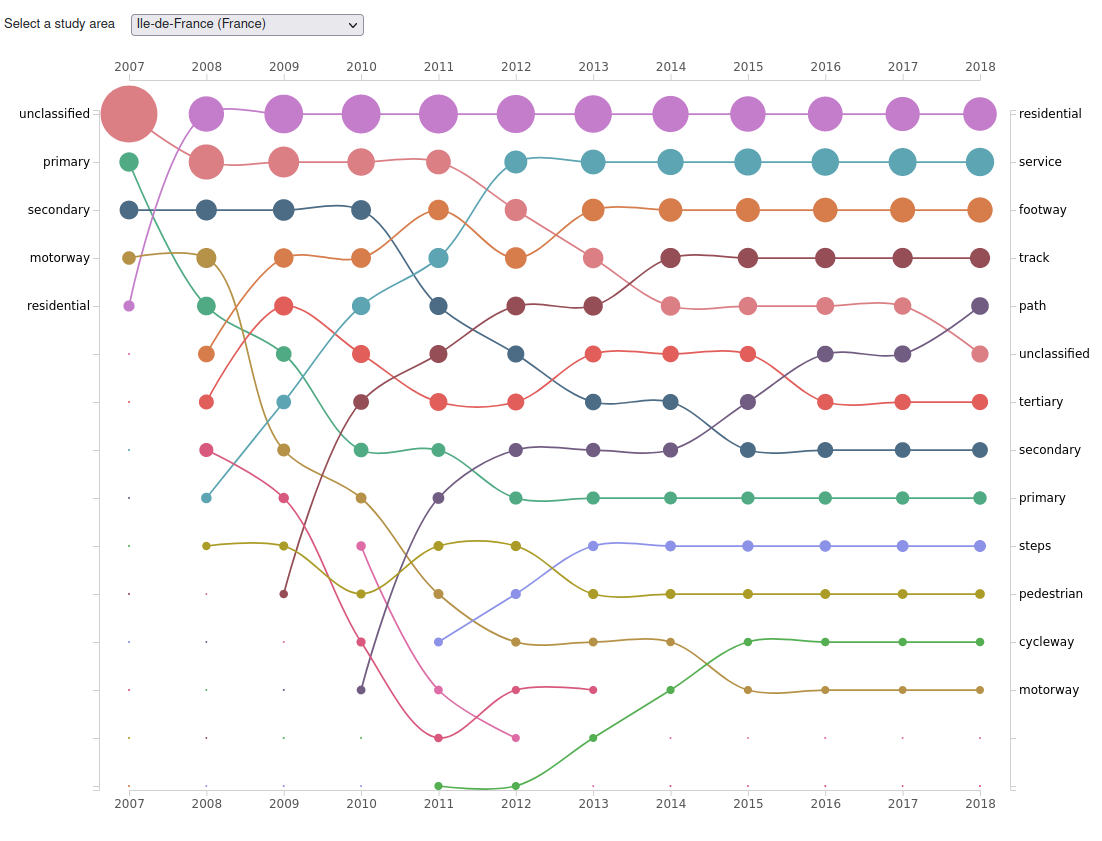
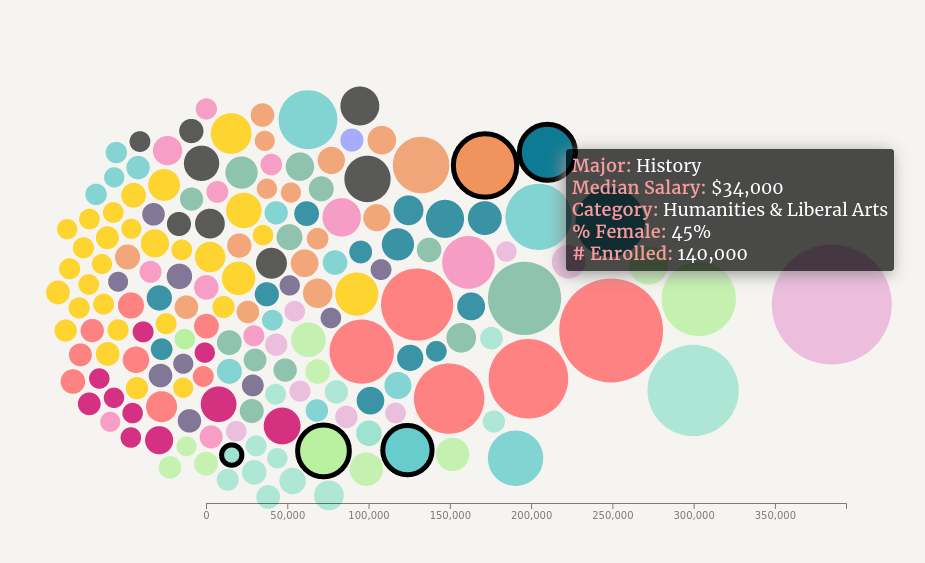
You can find a great collection of visualisations made with D3 over here.
Sounds good, how do I book?
Book before 30th April and get 15% off using the 'EARLYBIRD' code at checkout.
Individual
If you're booking for yourself or a friend sales closed
Business
If you're booking on behalf of an organisation sales closed
I have questions, how can I get in touch?
You can email me directly: hello[at]rgianni.cc
