Building a Stripe data export app with Bubble

Building a Stripe data export app with Bubble

Over the past few weeks I've been dabbling with Nocode tool Bubble.io. I've played with Make, Airtable, and IFTTT before, but nothing as involved as Bubble. As a developer, Nocode holds two attractions, the promise of accelerated development, and second, the opportunity to empower non-technical colleagues. Introducing Timely Exports…

The making of Super Map World - Part 1.

The making of Super Map World - Part 1.

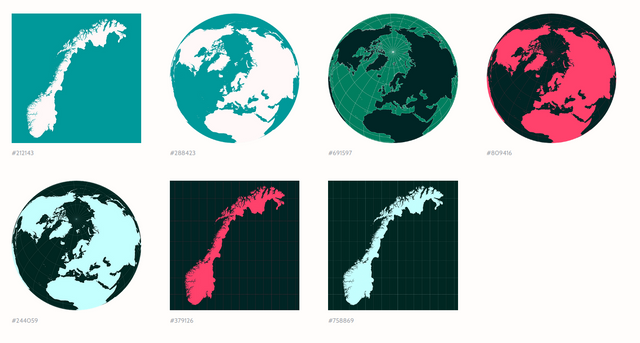
Super Map World is a site that offers over 17,000 maps and map graphics. They're colourful. They're free! And best of all, they're customisable using a map edit feature. It's one of the biggest side projects I've committed to. Over the course of the next few posts I'm going…

A drawing of Neurogliaform cells by Santiago Ramón y Cajal

Code & Learn: Set your mind in motion with a project vision

Figuring out where to start with a new programming language or framework can be challenging. Searching for advice can inundate you with long lists of prerequisites and concepts to learn. Forums will turn up tech veterans that demand newcomers "start from the ground up". The newcomers should know the fundamentals…

Using a text input to filter map data with Leaflet JS

Using a text input to filter map data with Leaflet JS

In this follow-up video, we add another method of filtering data on our doctors' practices map visualisation. If you're not too familiar with Leaflet or JavaScript in general, I recommend watching the first Leaflet.js video where we create our visualisation from scratch. You can find the complete map visualisation…

Dataviz: Connecting the Atlantic

Dataviz: Connecting the Atlantic

“A treaty of peace has been signed between Austria and Prussia” – the first message that was transmitted across the Atlantic via telegraph. That's the first connection that appears in this animated globe visualisation. It shows a timeline of various trans-Atlantic subsea telegraph connections starting with the first successfully laid cable…

D3.js Choropleth Map Code Walkthrough

D3.js Choropleth Map Code Walkthrough

Maps are some of the most shared and sought after forms of visualisation. In this  video, I walk through an example that visualises unemployment data at the US county level. The code was updated from this bl.ocks.org v4 example to use d3.js version 7.  The walkthrough touches…